
RB · ATL
Model192
Rank114
ADP115
Gap-77
RCS32.5 · backs the model (weak)
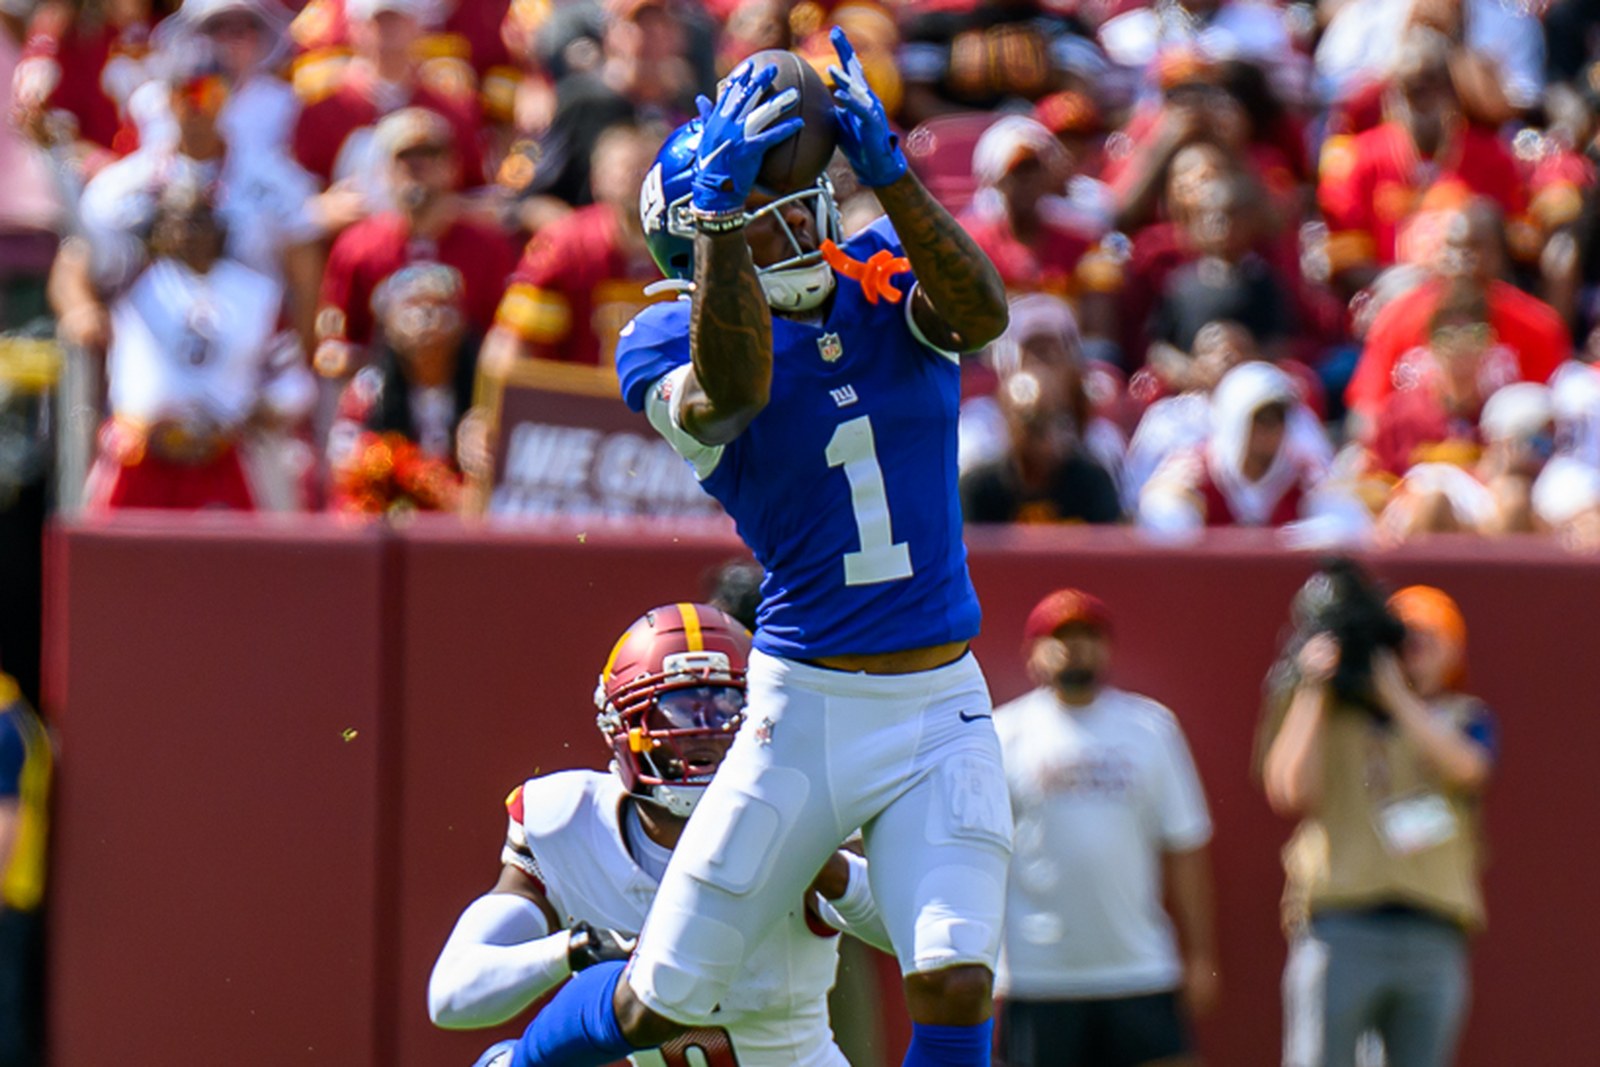
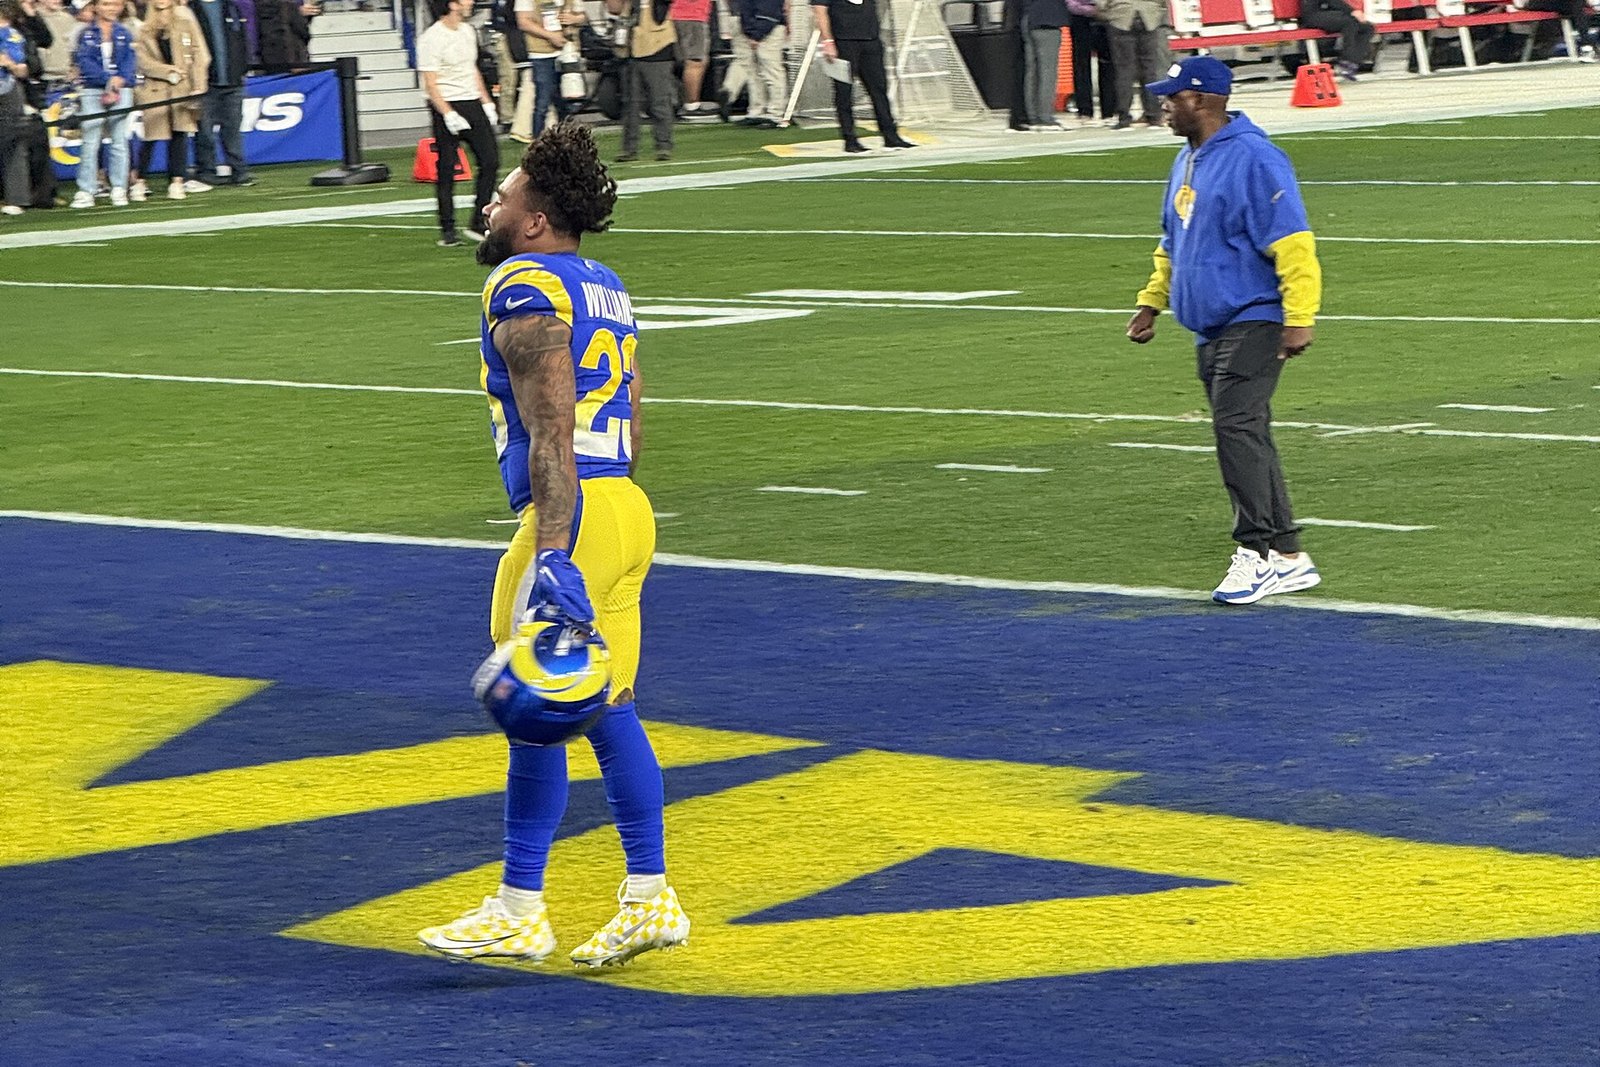
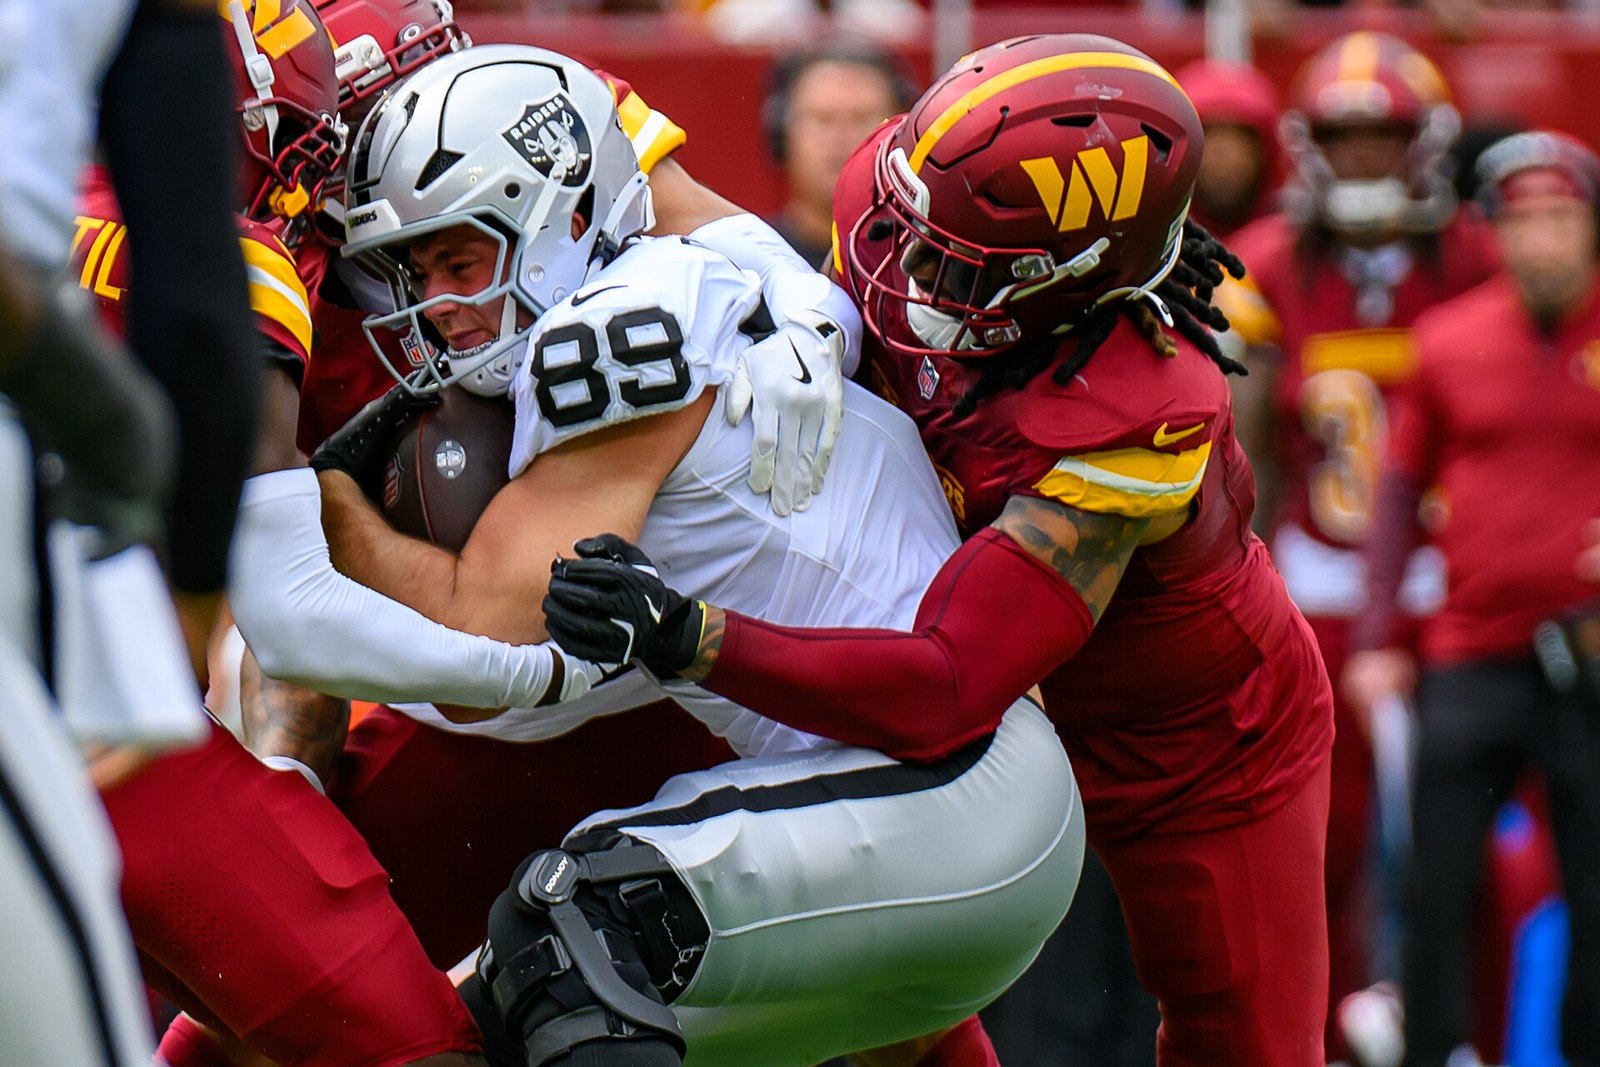
The short list: the dozen players where a metric is saying something and the market is somewhere else. The gap is draft position minus model rank (positive means the model is ahead of the market), and the blurb is the read. A gap with no metric behind it is just a rank difference, and the rankings table already shows those.
My rank sits closer to the market, on purpose.
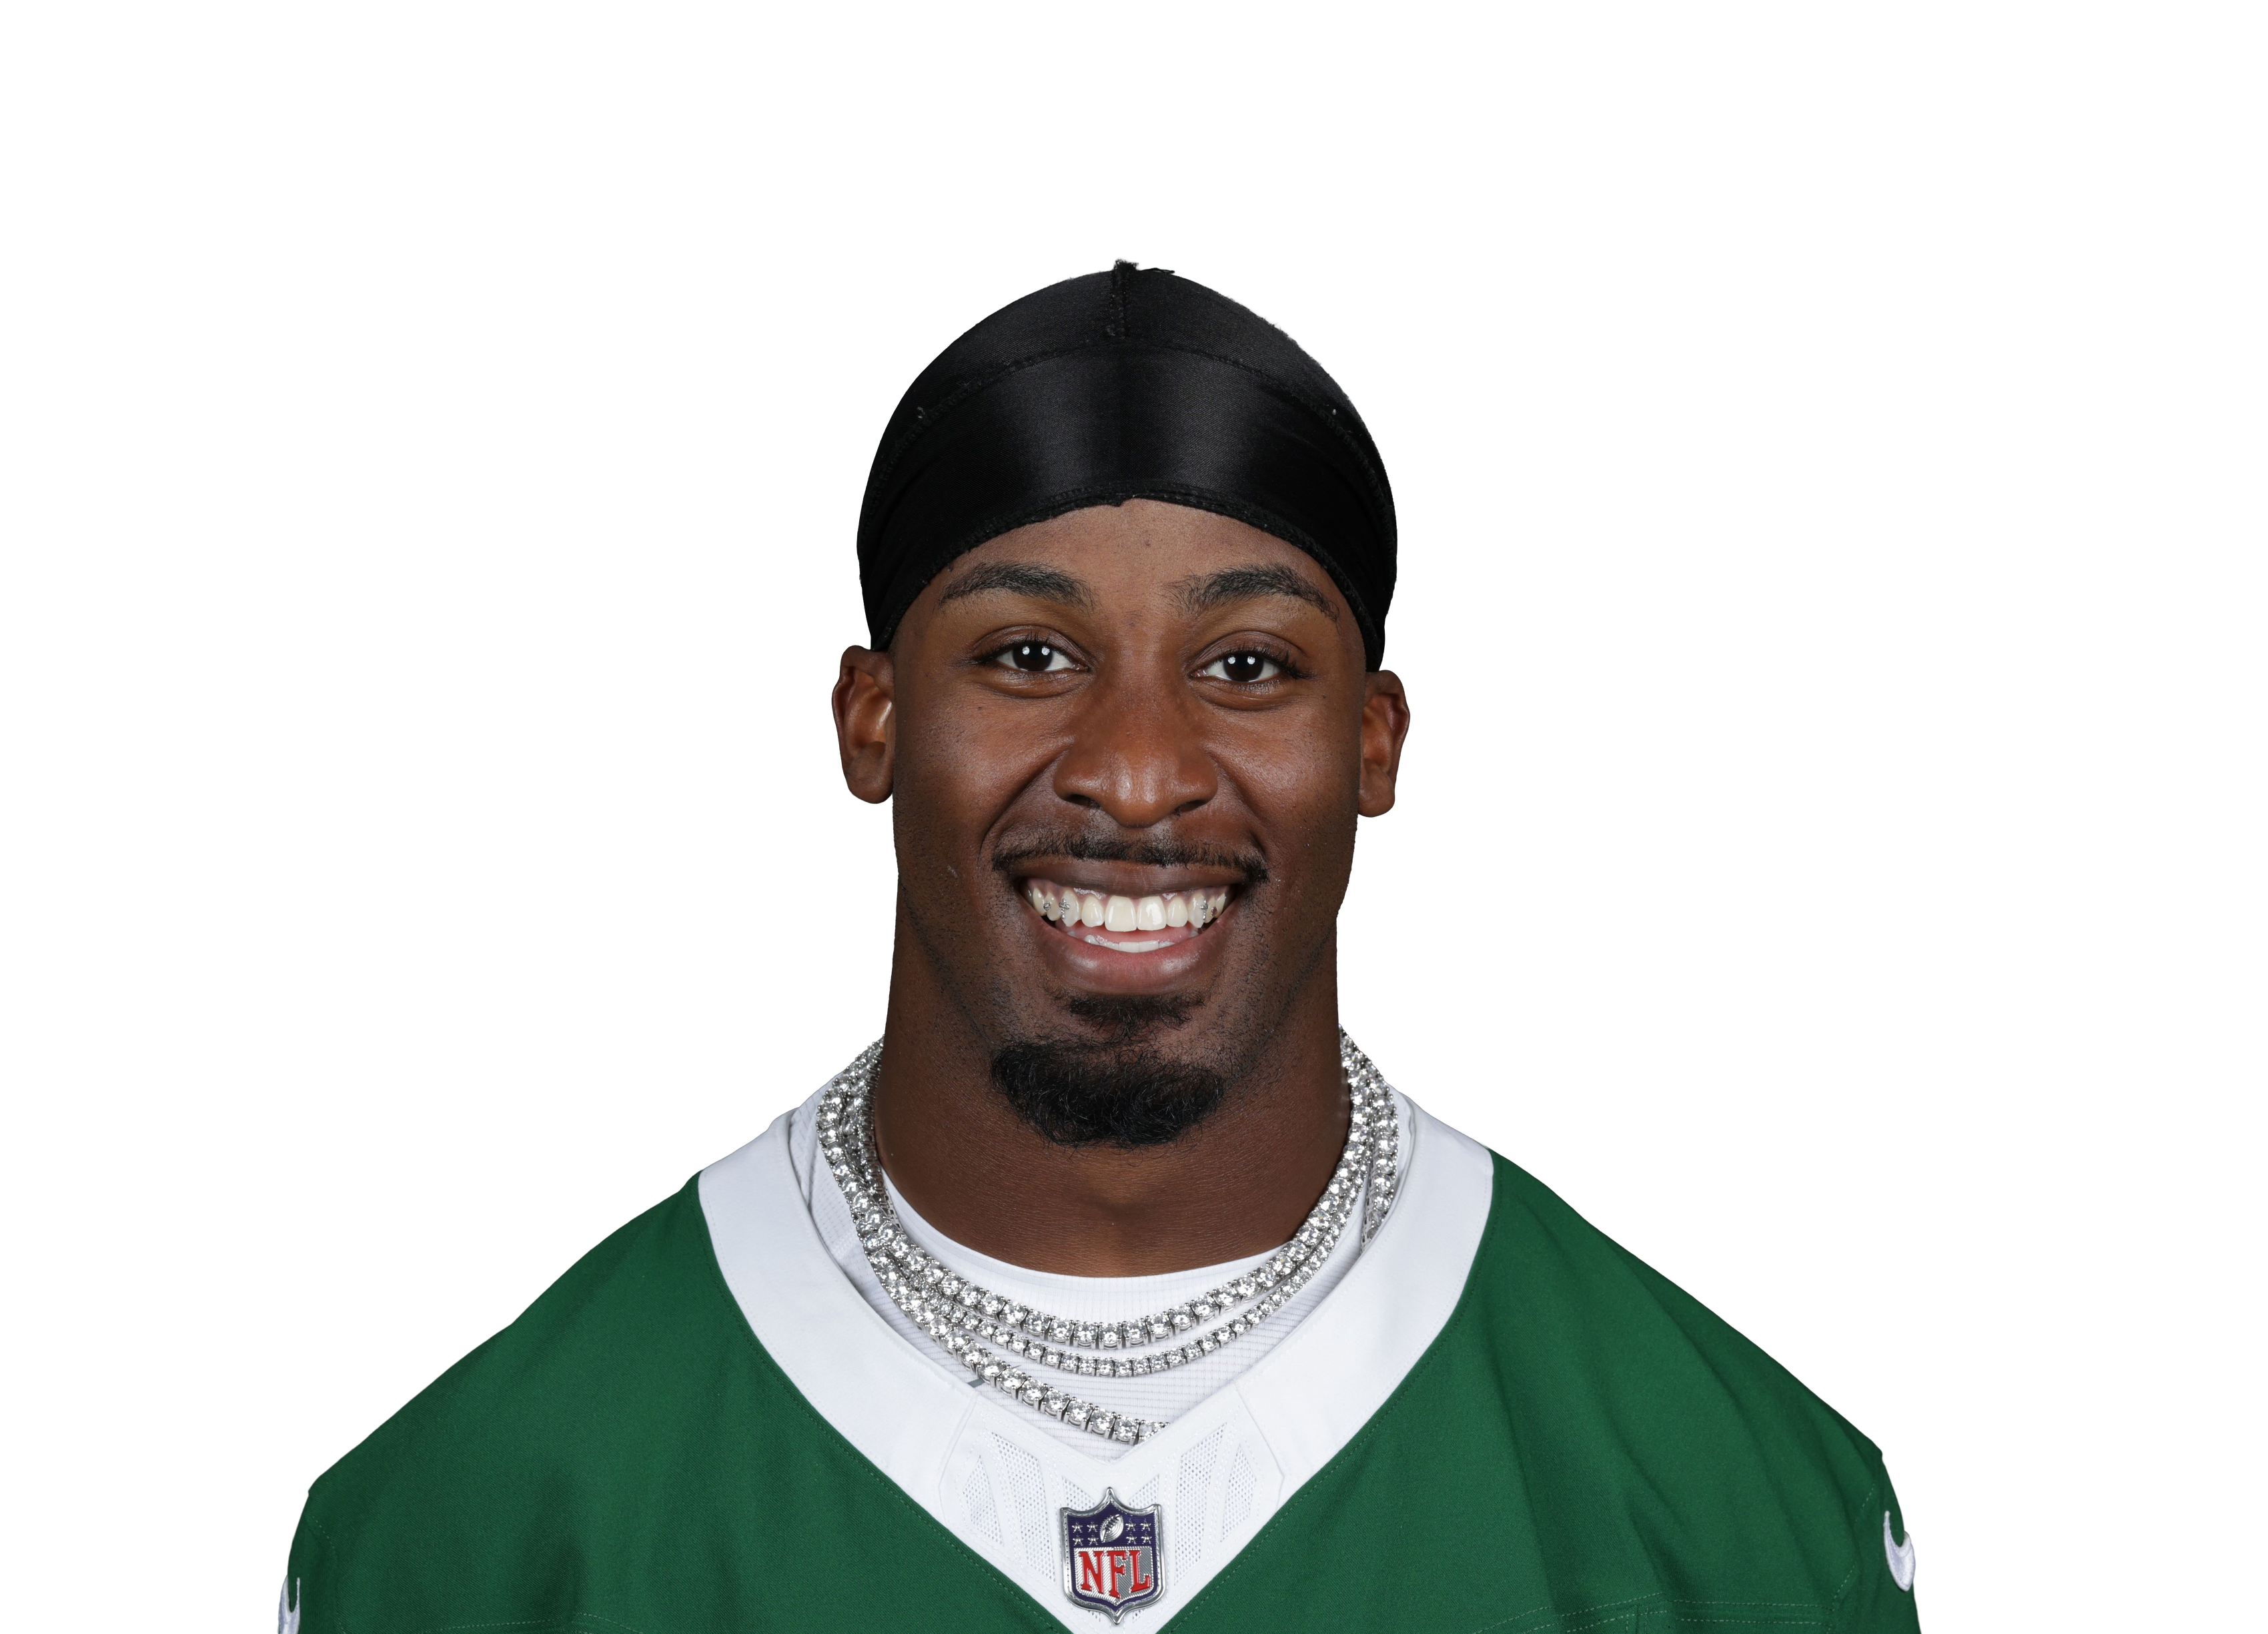
Three games missed; the role score is strong because the role is his when he plays, and the model's 107 is the share I cut for the games he hasn't. Me 45 with a band. Both are right about different things.
5 carries and a score, 4 targets Monday night; RCS weak, and Kyren had 70% of the carries. Model 144, market 76, me 90.
Splitting the difference between the model and the market.

The environment score was always strong; the team-total blend finally gives Detroit its 684-attempt pace. Model 55 (from 73), market 130, me 92.
31 for 367 and two scores against Chicago; the environment score stays strong. Model 83, market 140, me 106.
15 for 101 and 6 catches for 87 with Dowdle out a third game; RCS strong. Model 17, market 59, me 42. The gap is McCarthy's 'committee' when Dowdle is back, and the model now blends that in and still has him 17th.
The market has him wrong, and the model and I agree.
18 for 88 and a score, three straight weeks as the Dolphins' back; RCS strong. Model 47, market 319 (August), me 70. The offense is the cap and the metric doesn't grade offenses.
Last week the model had him 8th and I said the trend metric was counting the same games twice. Fixed, and with Price's return blended into the share he's 63rd, which is a number I can argue with. RCS still scores the role strong. Me 101, market 222.
25 for 113, 69% of the carries; RCS strong. Model 54, down from 38 this week because Mason's return after the bye is in the share now. Market 98, me 68. The calendar is doing the work the metric can't.